According to the latest numbers from Hotels.com, U.S. travelers are heading to Las Vegas and New York most frequently when traveling locally. Those who wandered abroad frequented London and Paris more than any other international destinations.
Where did American travelers go in 2016?
- Las Vegas was the #1 domestic destination for U.S. travelers
- London was the #1 international destination for U.S. travelers
What did we learn about travelers in 2016?
- The top three international destinations have remained consistent year over year: London, Paris and Toronto
- New York is the most popular tourist hub, as it came in as the #1 destination for international travelers
What did we learn about the top spenders?
- Domestically, travelers paid the most for rooms in Boston which had an average price of $266 per night
- Internationally, travelers paid the most for rooms in Playa Del Carmen, which had an average price of $241 per night
- Reykjavik, Iceland had a 17% increase in price paid, with an average price paid of $229
Where did travelers receive the best deals in 2016?
- The best U.S. hotel room values were found in Reno, Albuquerque and Oklahoma City. All around $100 price paid per night
- Istanbul is where travelers received the best value with a 29% decrease in price paid
- The Index also reported double digit decreases for Milan, Paris and London
- HPI reported the lowest international average price paid per night in Ho Chi Minh City, Vietnam and Bangkok, Thailand

Making the most of the resilient U.S. Dollar against a range of key currencies, U.S. travelers broke away from the norm and ventured beyond the U.S. border more frequently in 2016 compared to 2015, as the number of overseas trips taken in the first ten months of the year increased by 8%. With the Dollar’s relatively strong position, U.S. travelers paid less for their guestrooms in almost two-thirds of their 50 most popular international destinations. But, most price hikes – and falls, in fact – remained in single percentage figures, with only a handful in the double digits.
Canada and Europe got the lion’s share of the U.S. outbound tourism, and their average prices rose accordingly. Asia stayed popular with Americans and continued to represent excellent value for U.S. guests. In Latin America, average prices stayed up even though almost all of the most popular destinations in the region declined.
- Most popular outbound region: Europe
- Best value region: Asia
- Largest average price increase: Reykjavik at +17%
- Largest average price drop: Istanbul at -29%
Europe
Overall U.S. visitor numbers to Europe rose by 7% in the first 10 months of 2016 and 23 European destinations made it into the top 50. Of these popular destinations, prices rose in eight, remained unchanged in two and fell in 13.
London retained its title as the most popular foreign destination for American travelers. The capital’s long-standing appeal as an international travel destination got some help with average hotel room prices falling by more than 10 percent, which was likely due to the drop in the value of the Pound following the surprising Brexit vote in June 2016.
Edinburgh also saw a slight fall in room prices. However, when you check averages paid from July to December 2016 with the same period in 2015, both Edinburgh and London were down by several more percentage points.
Latin America
All eight of the Latin American destinations in the top 50 saw a drop in their average hotel room prices.
Bogota was the only Latin American city on the list with a nightly average of less than $100 and it also showed the largest decrease in the region.
U.S. travel to Mexico increased by 9% in the first 10 months of 2016. Four resort areas made it to the top 50 international destinations for Americans and all showed slight price decreases. Cancun already expected record visitor numbers for 2016 and remained the most popular Mexican resort area for U.S. travelers.
| City | Country | 2016 ($) | 2015 ($) | % Change | 2016 popularity ranks |
| Playa Del Carmen | Mexico | 241 | 252 | -4% | 37 |
| Cancun | Mexico | 229 | 236 | -3% | 23 |
| San Juan | Puerto Rico | 182 | 199 | -9% | 29 |
| Puerto Vallarta | Mexico | 149 | 152 | -2% | 47 |
| Buenos Aires | Argentina | 127 | 136 | -7% | 40 |
| Mexico City | Mexico | 125 | 132 | -5% | 11 |
| Panama City | Panama | 102 | 106 | -4% | 36 |
| Bogota | Colombia | 89 | 97 | -8% | 35 |
Average prices paid per night by U.S. travelers in selected European destinations in 2016 compared with 2015
| City | Country | 2016 ($) | 2015 ($) | % Change | 2016 popularity rank |
| London | United Kingdom | 230 | 258 | -11% | 1 |
| Reykjavik | Iceland | 229 | 196 | 17% | 42 |
| Venice | Italy | 211 | 221 | -5% | 22 |
| Paris | France | 184 | 209 | -12% | 2 |
| Dublin | Ireland | 184 | 171 | 8% | 17 |
| Milan | Italy | 183 | 216 | -15% | 38 |
| Barcelona | Spain | 182 | 173 | 5% | 8 |
| Rome | Italy | 164 | 172 | -5% | 5 |
| Vienna | Austria | 151 | 153 | -1% | 32 |
| Athens | Greece | 143 | 143 | 0% | 46 |
| Madrid | Spain | 138 | 134 | 3% | 14 |
| Prague | Czech Republic | 132 | 131 | 0% | 27 |
| Berlin | Germany | 131 | 132 | -1% | 18 |
| Budapest | Hungary | 125 | 121 | 3% | 50 |
| Istanbul | Turkey | 88 | 124 | -29% | 43 |
Asia
There were 12 Asian destinations in the top 50, with prices paid falling in eight and rising in four.
The destinations with the two lowest average hotel room prices were Ho Chi Minh City and Bangkok, both offering value at under $100 a night.
For the price of only one night in Playa del Carmen in Mexico, American travelers could have spent three nights in the Vietnamese capital.
Average prices fell in the two Thai destinations in the top 50, but tourism to Thailand was thriving with record numbers.
Taipei and Singapore recorded the highest average price percentage decreases in Asia overall.
With the Japanese Yen regaining some lost ground against the Dollar, average prices paid per night in Kyoto and Tokyo both rose sharply, making them the two most expensive Asian destinations on average for U.S. travelers in 2016. However, visitors to Tokyo were clearly undeterred by the steeper prices, since the Japanese capital was still the most popular Asian destination for U.S. travelers.
Average prices paid per night by U.S. travelers in the most popular Asian destinations in 2016 compared with 2015
| City | Country | 2016 ($) | 2015 ($) | % Change | 2016 popularity rank |
| Kyoto | Japan | 185 | 166 | 11% | 49 |
| Tokyo | Japan | 184 | 178 | 4% | 4 |
| Singapore | Singapore | 166 | 181 | -8% | 15 |
| Hong Kong | Hong Kong | 162 | 170 | -5% | 7 |
| Shanghai | China | 158 | 153 | 4% | 25 |
| Beijing | China | 135 | 139 | -3% | 34 |
| Bali | Indonesia | 129 | 132 | -2% | 28 |
| Taipei | Taiwan | 127 | 140 | -9% | 30 |
| Seoul | South Korea | 124 | 129 | -4% | 13 |
| Phuket | Thailand | 112 | 118 | -5% | 24 |
| Bangkok | Thailand | 86 | 91 | -6% | 6 |
| Ho Chi Minh City | Vietnam | 82 | 80 | 2% | 39 |
Rest of the world
The relative weakness of the Australian Dollar made hotel prices a bit more attractive to U.S. visitors in 2016.
With more than 40 percent of its hotel rooms in the 5-star category, average rates paid in Dubai remained relatively high, but American travelers still ended up paying less for their room nights in the Emirates in 2016 compared with the year before.
Average prices paid per night by U.S. travelers in selected international destinations in 2016 compared with 2015
| City | Country | 2016 ($) | 2015 ($) | % Change | 2016 popularity rank |
| Sydney | Australia | 190 | 192 | -1% | 21 |
| Dubai | United Arab Emirates | 189 | 205 | -8% | 16 |
| Melbourne | Australia | 149 | 156 | -5% | 45 |
What U.S. travelers paid in their top 50 domestic destinations
Amongst the most popular domestic destinations for U.S. travelers, prices paid rose in more than half, fell in 14 and were flat in six. In the country as a whole, domestic hotel guests paid 1% more per night than in 2015 on average.
The West Coast experienced similarly mixed fortunes: Los Angeles set a new record for visitor numbers so domestic visitors paid 6% more on average in 2016, whereas San Diego experienced no change and San Francisco’s average room rates fell by 3%.
Perhaps unsurprisingly given the high drama of the elections, Washington D.C. had one of the highest average price increases at 7%, as both domestic and international visitors were drawn to the nation’s capital and political power center.
Two other destinations, Orlando and Albuquerque, saw no change and still provided great value with averages of under $115 per night.
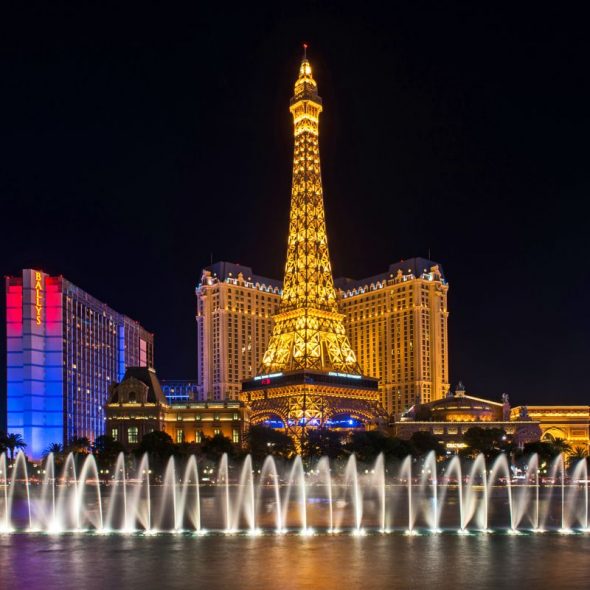
Las Vegas was the most popular domestic destination in 2016 and average prices were boosted by another year of record visitor numbers.
Average prices paid per night by U.S. travelers in selected U.S. destinations in 2016 compared with 2015
| City | State | 2016 ($) | 2015 ($) | % Change | 2016 popularity rank |
| USA | 132 | 131 | 1% | ||
| Boston | MA | 266 | 277 | -4% | 20 |
| New York | NY | 258 | 263 | -2% | 2 |
| San Francisco | CA | 231 | 238 | -3% | 4 |
| Washington | DC | 227 | 212 | 7% | 15 |
| Los Angeles | CA | 198 | 188 | 5% | 13 |
| New Orleans | LA | 192 | 202 | -5% | 14 |
| Miami | FL | 190 | 203 | -6% | 9 |
| San Diego | CA | 157 | 157 | 0% | 5 |
| Tampa | FL | 129 | 120 | 7% | 23 |
| Las Vegas | NV | 127 | 124 | 3% | 1 |
| Orlando | FL | 114 | 113 | 0% | 3 |
| Houston | TX | 121 | 130 | -7% | 8 |
| Reno | NV | 100 | 93 | 8% | 31 |
| Albuquerque | NM | 92 | 92 | 0% | 30 |















Get Social